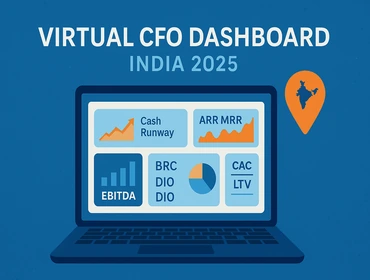
The Virtual CFO Dashboard: 15 Metrics India Founders Should Track
The Virtual CFO India 2025 is all about faster, better decisions. This Top-in-India framework outlines the 15 CFO dashboard metrics every Indian startup/SME should watch — from cash runway & burn multiple to EBITDA margin, DSO/DPO/DIO, ARR/MRR, CAC:LTV, unit economics and board MIS. Need help? Our Virtual CFO services are known as Top virtual CFO firms in India and the Best outsourced CFO for clean, investor-grade dashboards — truly Top-notch service in India.
Table of contents
1) Liquidity & Cash runway (1–3)
2) Profitability & Efficiency (4–6)
3) Working Capital (7–9)
4) Revenue Engine & Retention (10–12)
5) Control, Forecast & Board MIS (13–15)
Common mistakes to avoid
Why Vinstreak (Top-notch service in India)
FAQs
Pro tip: Decide your cadence — weekly for cash/collections, monthly for profitability/KPIs, quarterly for strategy. Lock owners and data sources to keep your Best CFO dashboard India reliable.
1) Liquidity & Cash runway
Your survival meters. Prioritise visibility and alerts.
- Cash Runway (Months) — cash & equivalents ÷ average monthly burn. Tag “Top risk” if < 9 months for venture-backed; aim 12–18 months.
- Burn Multiple — net burn ÷ net new revenue. Best-in-India target ≤ 1.5 in growth, ≤ 1.0 in efficiency mode.
- Operating Cash Flow (OCF) — trend vs EBITDA; persistent gaps flag collections or inventory issues.
2) Profitability & Efficiency
Quality of earnings drives valuation and resilience.
- Gross Margin % — by product/channel; Top dashboards show mix shifts and price discounts.
- EBITDA Margin % — add waterfall: gross profit → Opex blocks (S&M, G&A, R&D) for clean Board MIS.
- Opex Ratio — Opex/Revenue; Best CFOs track efficiency vs hiring plan and automation savings.
3) Working Capital Discipline
Freeing cash beats raising cash.
- DSO (Days Sales Outstanding) — collections velocity; add top-10 overdue and collector-wise targets.
- DPO (Days Payables Outstanding) — negotiate India-centric credit; protect vendor relationships.
- DIO (Days Inventory Outstanding) — stock turns, dead/slow-moving alerts; link to purchase planning.
4) Revenue Engine & Retention
Sustainable growth beats headline growth.
- ARR/MRR — growth rate, net new, expansion vs contraction; Top SaaS dashboards show logo churn and net revenue retention.
- CAC : LTV — by channel/segment; Best practice: payback period in months ≤ 12 (SaaS) or ≤ 18 (enterprise).
- Cohort Retention & Churn — revenue and logo cohorts; plot India-specific seasonality and pricing experiments.
5) Control, Forecast & Board MIS
Make the Board pack investor-grade.
- Budget vs Actuals (BvA) — revenue, margin, Opex, headcount; add variance drivers and corrective actions.
- 12-Month Rolling Forecast — cash, P&L, and working capital; scenario A/B with hiring and pricing toggles.
- Compliance & Controls Score — GST/ROC/IT status, audit remarks, and policy adherence; Top-notch dashboards prevent surprises.
Common mistakes to avoid (and quick fixes)
- Too many KPIs, no owners — Fix: 15 metrics, one owner each, weekly/ monthly rhythm.
- Vanity revenue without cash focus — Fix: collections sprints, DSO SLA, incentive hooks.
- Stale budgets — Fix: rolling forecast, scenario tests, hiring gates.
- No drilldown — Fix: product/channel views, cohort tables, and exception reports.
- Manual board packs — Fix: one data model, automated BvA, and audit-ready trails.
Virtual CFO India 2025
CFO dashboard metrics India
Cash runway India
Burn multiple
EBITDA margin
DSO DPO DIO
Working capital cycle
ARR MRR
CAC LTV
Cohort retention
Board MIS India
Best virtual CFO services India
Top virtual CFO firms India
Top-notch service in India